How we measure Your mirrors?
Surface FIGURE ERROR measuring
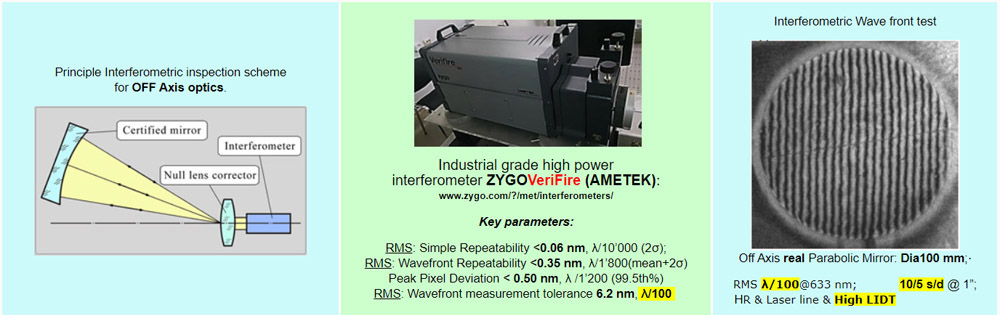
Standard measuring methodologies of surface figure tolerance for OFF axis optics
...........................................................page 1p1
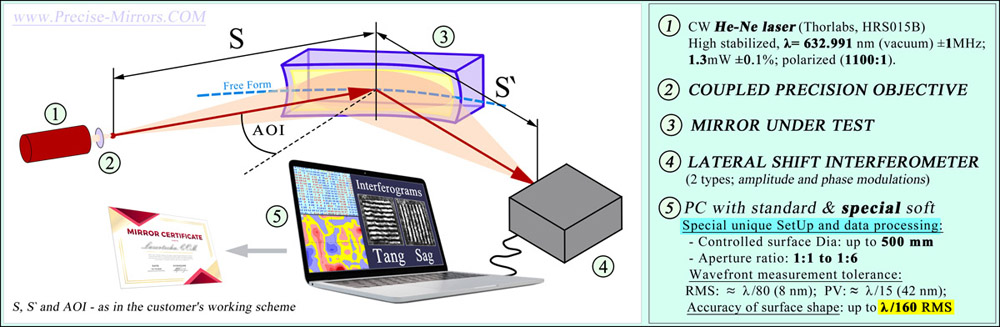
Our unique INTERFEROMETRIC setup ("know-how") for certification of mirrors at work AOI.
..........................................page 1p2
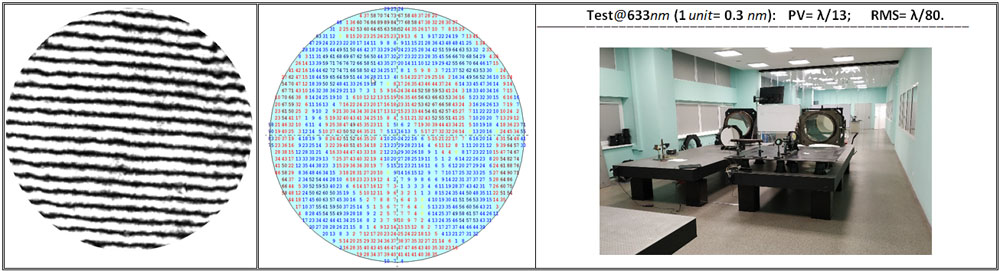
Standard methodologies of data processing after interferometric measuring: slope error calculating................................page 1p3
Standard measuring Zygo methodologies of surface figure tolerance for ON axis optics
...................................................page 1p4
Focal spot analyze and measuring
Experemental schemes for focal spot measuring
..................................................................................................................page 2p1
Theoretical focal spot analyze (ZEMAX) - rays tracing - example one
..................................................................................page 2p2
Theoretical focal spot analyze (ZEMAX) - rays tracing - example two (2f-2f
geoometry)
......................................................page 2p3
Theoretical focal spot analyze (ZEMAX) - statistical methods
...............................................................................................page 2p4
Mirror substrate microroughness measurements
Features of MICRO roughness measurement using optical profilers
....................................................................................page
3p1
Measuring of surface roughness for mirror certification by optical profilers
.........................................................................page 3p2
Measuring of coated mirror surface roughness by Atomic Force Microscope
....................................................................page 3p3
Measuring of Irregularity (shape accuracy) of Off Axis Parabolic Mirror #200707(Ø630x75mm, 53kg): Interferogram & 2Dmap deviation
(very important for customer setups with grazing angles schemes, here add information about this phenomenon)
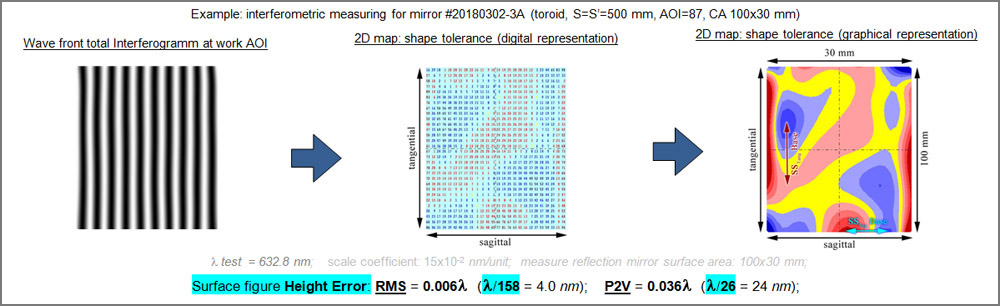
Standard methodologies of data processing after interferometric measuring:
surface figure tolerance analyze.
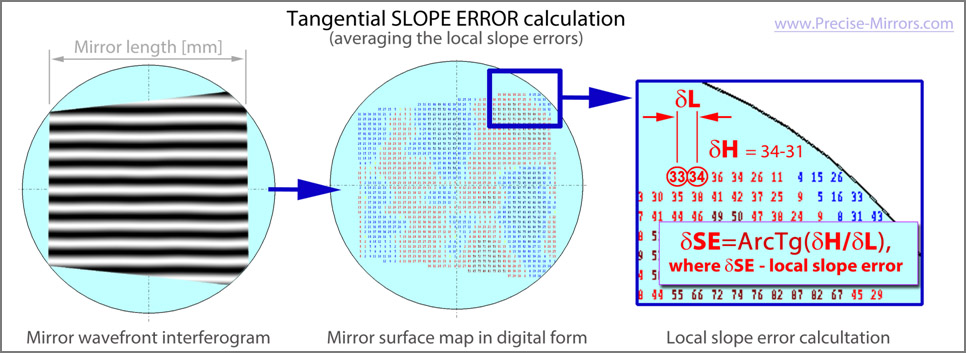
Standard methodologies of data processing after interferometric measuring: slope error calculating.
Description of the method for slope error calculating using the example of calculating the tangential slope error
For sagittal slope error calculation – the same method, but the distance between the measurement points is used along the width of the mirror.
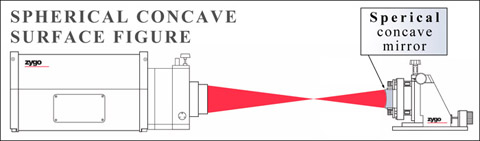
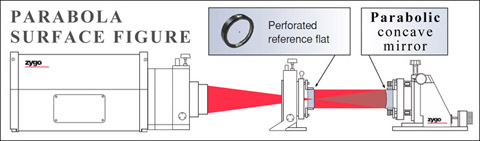
For other types of optics You can find standard Zygo methodologies at Zygo official web www.zygo.com
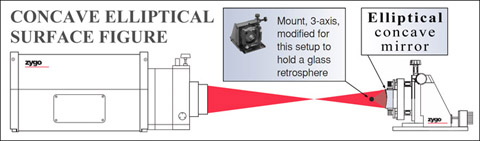
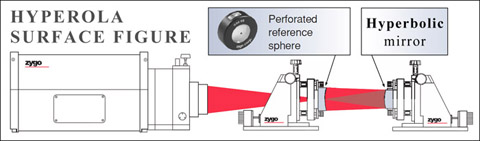
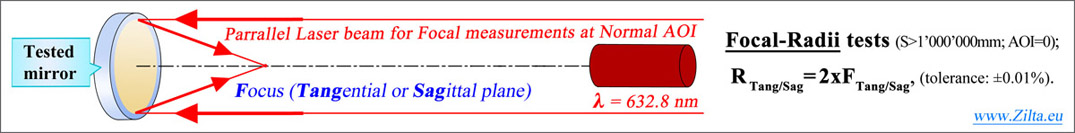
EXPERIMENTAL focal spot analysis (incl. "Focal Length" measurements) for ON AXIS concave mirrors at normal AOI.
EXPERIMENTAL focal spot analysis (incl. "Focal Length" measurements) for OFF AXIS concave mirrors at work AOI.
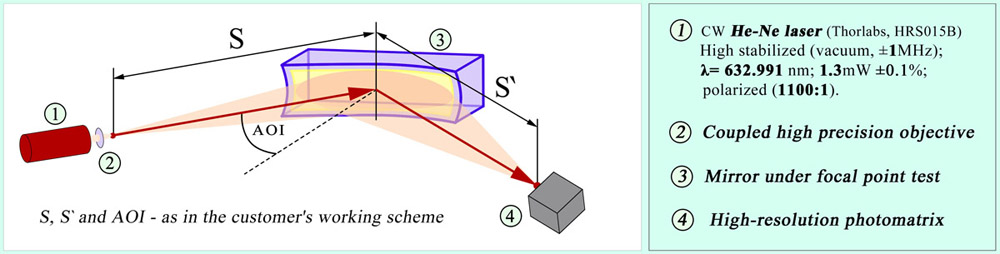
Software used for mirrors focal points measurements (for work & certification):
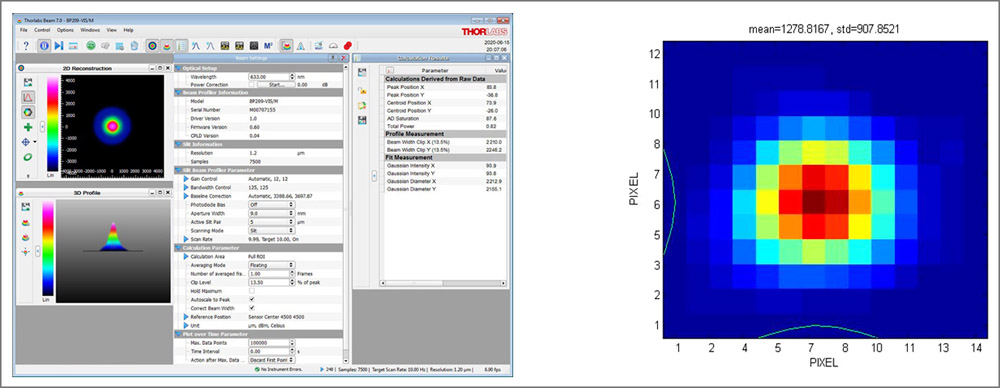
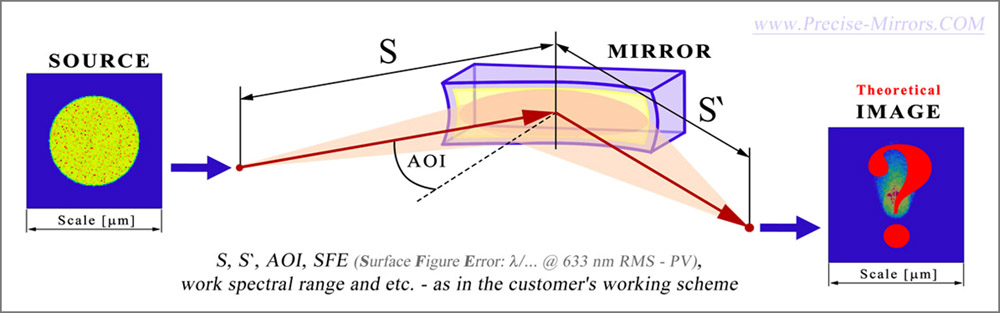
VISUALIZATION
–RAYS TRACING
(tacking in to account diffraction limitations and manufacture tolerance of mirrors surfaces).
SFE — Surface Figure Error (by default RMS, test λ = 633 nm) — tolerance of mirror surface figure manufacture.
FSD — Focal Spot Diameter calculated from ZEMAX encircled energy graphs. By default FSD is
FWHM (74% of energy is inside the focal spot).
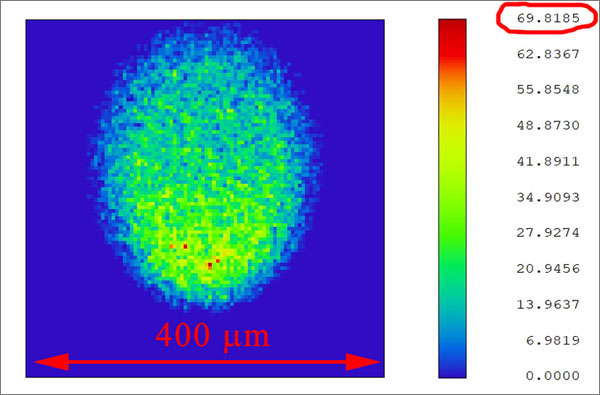
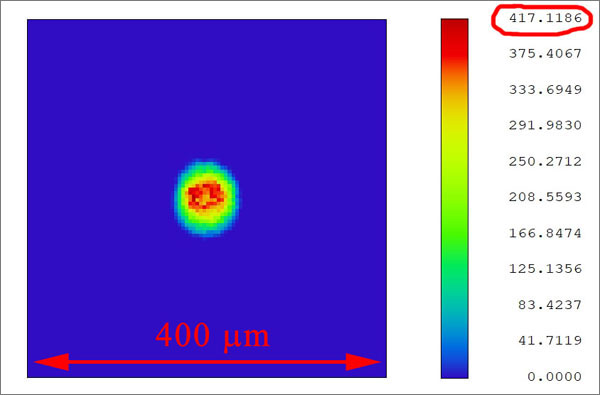
Example 1: S=1500 mm, S′=500 mm, AOI=850, CA 100x10 mm, work wavelength
λ= 57 nm, source Ø 200 μm (P2V).
VISUALIZATION–theoretical image of LARGE light source (Ø200 μm):
Toroidal mirror,
SFE λ/130
Precise aspherized toroidal mirror,
SFE λ/90
ULTRA precise elliptical mirror,
SFE λ/160
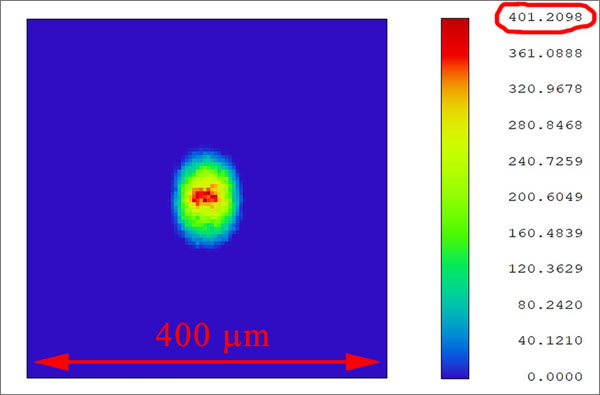
Example 2 (2f-2f geometry): S=300 mm, S′=300 mm, AOI=800, CA 115x20 mm, work wavelength
λ= 100 nm, source Ø 10 μm (P2V).
VISUALIZATION–theoretical image of SMALL light source (Ø10 μm):
Toroidal mirror,
SFE λ/130
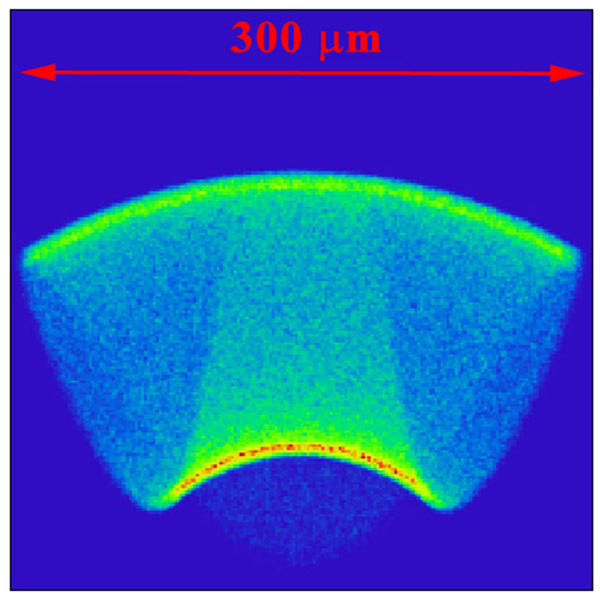
Very high SFE tolerance (high price),
but very bad focal point
Precise aspherized toroidal mirror,
SFE λ/90
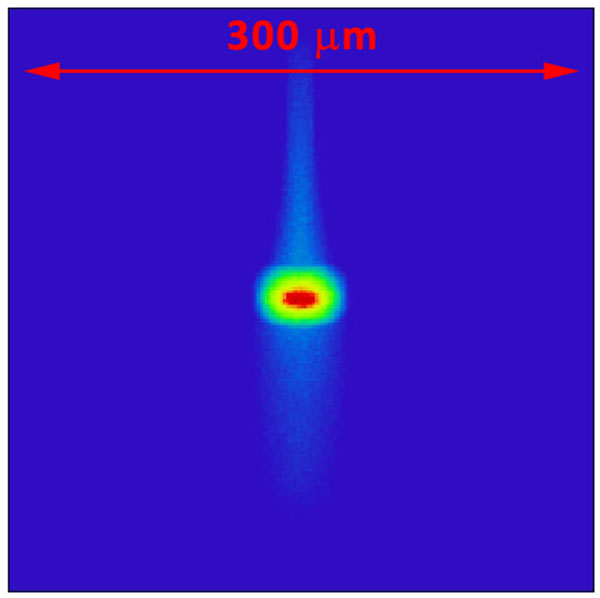
Not very high SFE tolerance (good price),
and relatively good focal point
ULTRA precise elliptical mirror,
SFE λ/160
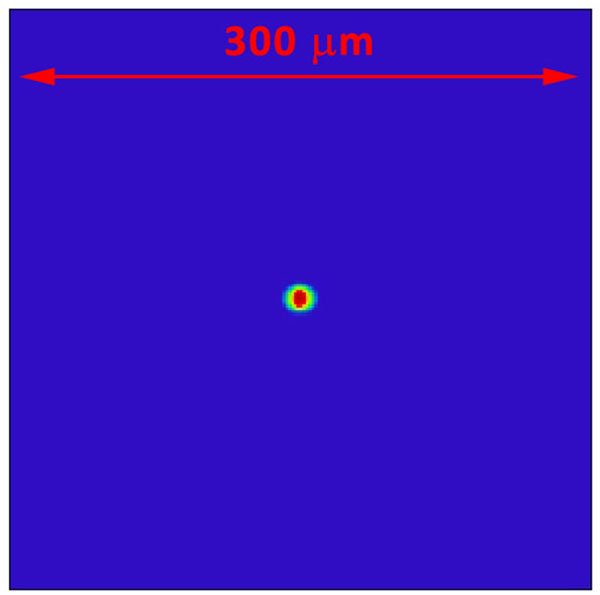
ULTRA high SFE tolerance (very high price),
and maximum best focal point
STATISTICAL METHODS
for theoretical focal spot size analysis (Root-Sum-Square and "Monte Carlo" models).
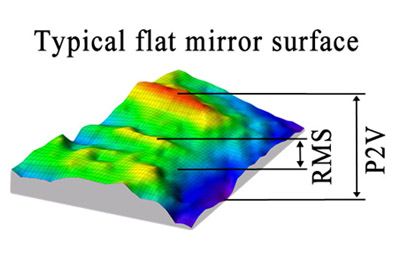
The surface of a real mirror is different from that of an ideal mirror. For example, a flat mirror has its own "highs and lows" on its surface (see the illustration in the figure on the left). There are similar defects on the surface of any other real mirrors. Knowing from interferometric measurements the value of the root-mean-square deviation (RMS) of the real mirror surface from the ideal one, one can estimate the influence of these defects on the formation of the minimum focal spot. Considering that for standard polishing methods these defects on the surface of mirrors are distributed randomly, it is necessary to use statistical methods of data processing.
In ZEMAX there are various methods that allow you to analyze the pseudo-stochastic distribution
of defects on the surface of mirrors.
We use the TEZI operand in conjunction with the Root-Sum-Square
and "Monte Carlo" models. An example of such calculations is below.
Example of statistical methods use in theoretical focal spot size analyze at λwork = 60 nm
From interferometric surface figure tolerance measurements (at λtest=633
nm) we have value
of «Surface Figure Error» ≡ «Height Error» = 4 nm (RMS).
By substituting this value in statistical models, it is possible to
estimate the spot size that will result at a wavelength λwork = 60 nm
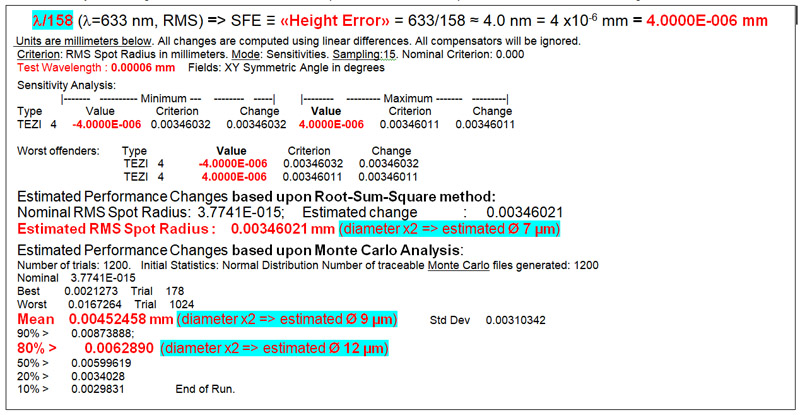
Conclusion: with surface figure tolerance RMS 4 nm (λ/158, interferometric measurements at λ=633 nm),
the expected calculated size of the focal spot at λwork = 60 nm is Ø 7-12 μm.
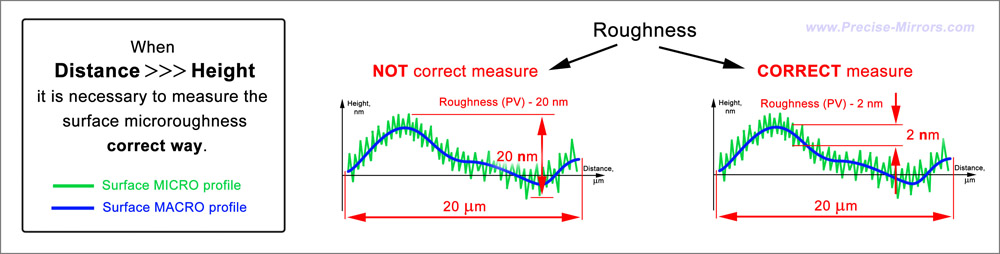
Features
of MICRO roughness substrate surface measurement using optical
profiles
(description of the CORRECT methodology).
When measuring surface MICRO roughness with the help of optical instruments, it must be taken into account that such instruments often cannot correct the calculation taking into account the deviation of surface shape changes in the MACRO scale.
As a result, the values of microroughness obtained in such an incorrect way do not allow one to estimate, for example, the amount of scattering losses for EUV/XUV radiation.
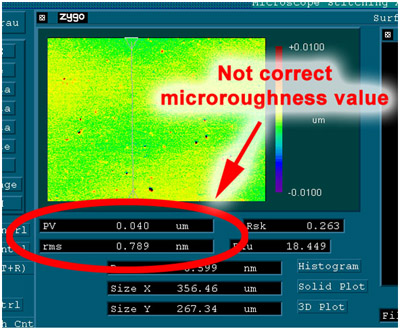
Example of not correct microroughness calculation
by Zygo NewView 5000 software
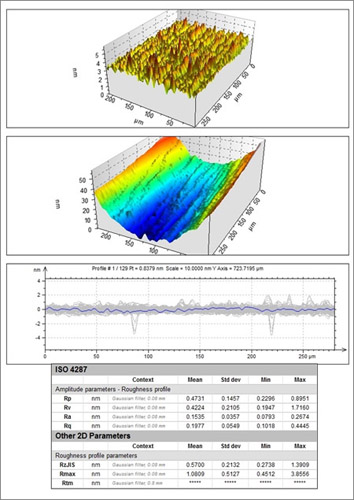
Measuring of surface roughness for mirror certification by
Optical Profiles
(height resolution±0.1 nm, horizontal resolution ±0.5 μm).
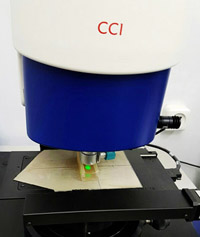
Roughness measurements by
Taylor Hobson 3D CCI MP-3D Optical Profiler
(typical measurements Rq=0.19 nm at normal AOI)
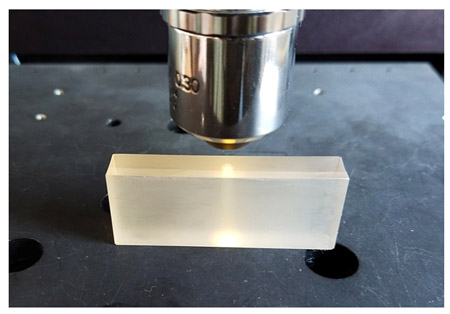
Surface analyze by
Zygo NewView5000
(typical value Rq=0.14 nm at normal AOI)
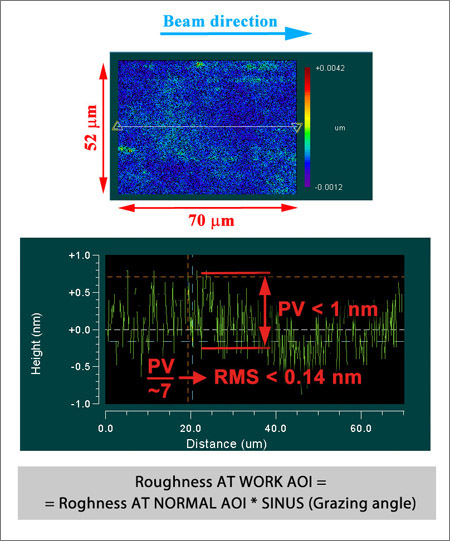
Measuring of coated mirror surface roughness for certification by
Atomic Force Microscope
(height resolution ±0.05 nm, horizontal resolution ±0.5 nm).
Example: mirror #202104-003 (S=S′=1201 mm, AOI=87o, special XUV coating) roughness measurements by
INTEGRA Spectra M (NT-MDT)
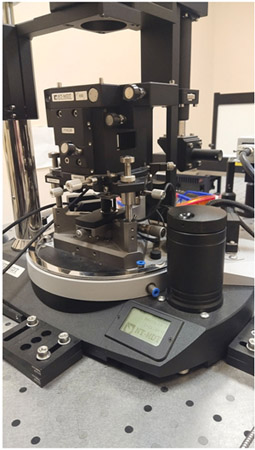
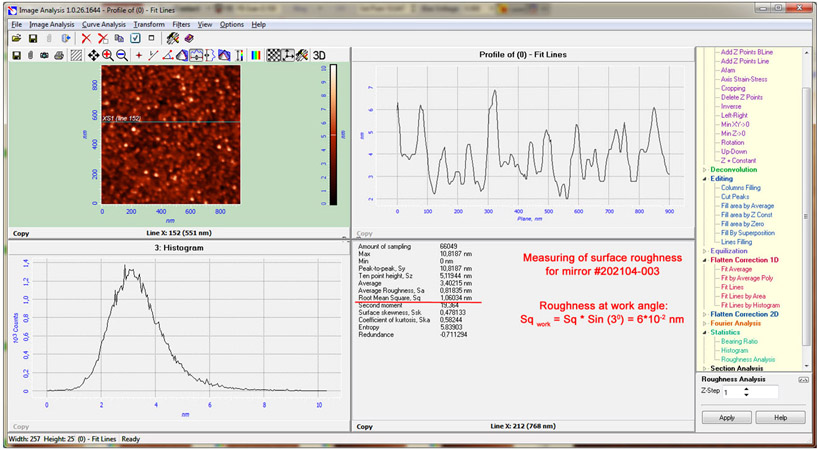
Roughness Sq work=0.06 nm, RMS,±0.01 nm, at work AOI
